The codes mentioned above can be used in rates and expenses, or only in expenses. We invite you to consult the full report for more information. Below is a graph showing the evolution of the breakdown by volume of nomenclature codes used for the rates:
No selection
2022
WE ARE INTERESTED IN YOUR OPINION Do you have any experience in this area ? We listen to you !
On this table, when a statistical test has been performed, the data showing a significant difference is displayed on an yellow background, otherwise on a grey background.
CODES
LABEL
CREATION
DELETION
477131
477142Electroencéphalographie
01-04-1985
477411
477422Enregistrement électroencéphalographique continu pendant 24 heures au moins, au moyen d'un appareil portable (technique type Holter) avec minimum 4 dérivations, y compris la consultation lors de la pose et de l'enlèvement de l'appareil, avec protocole et extraits des tracés
01-04-1985
477610
477621Electroencéphalographie quantitative avec 19 canaux au moins
01-11-2012

 Nomenclature codes
 Age, gender and CV
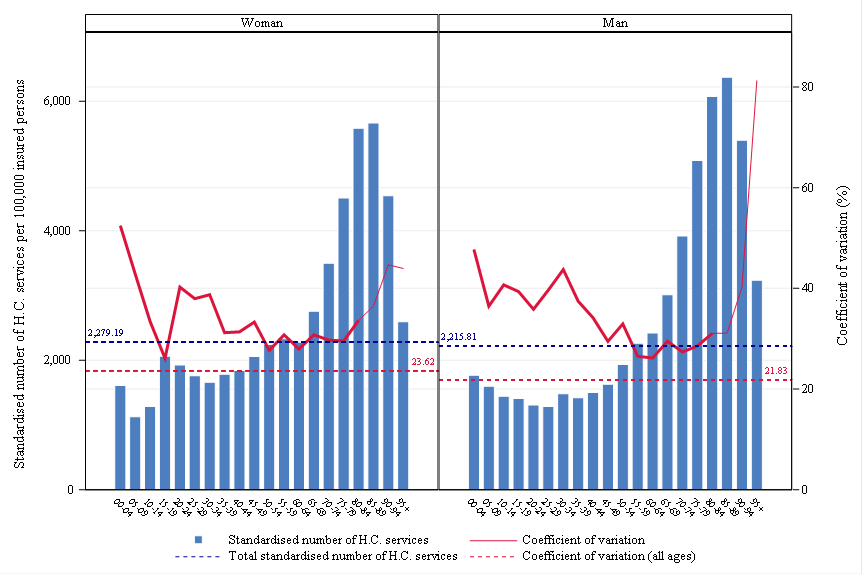
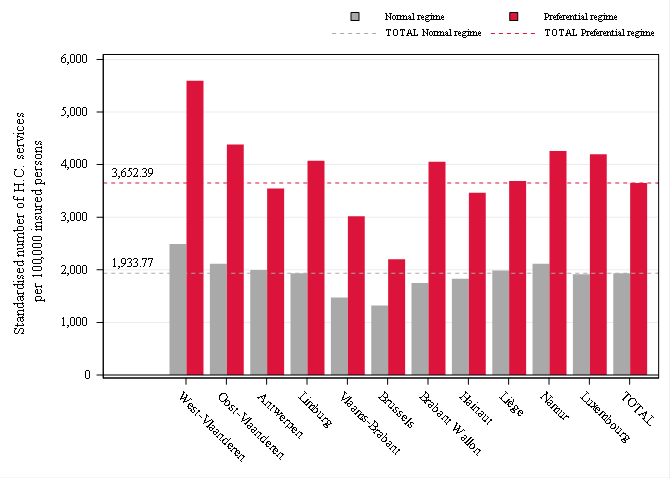
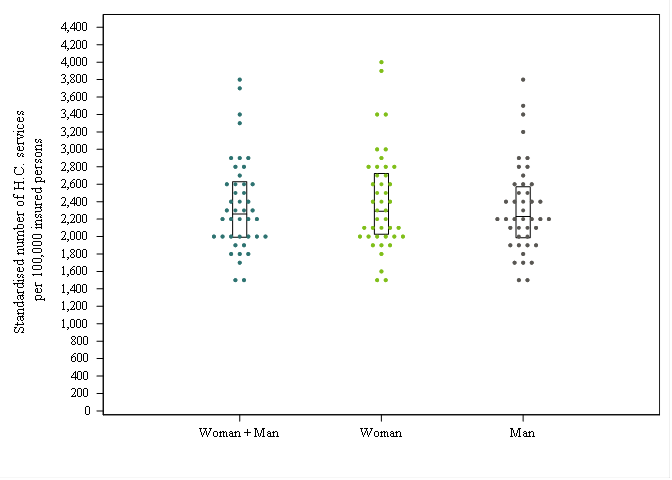
 Rates by sex
 Reimbursement rate
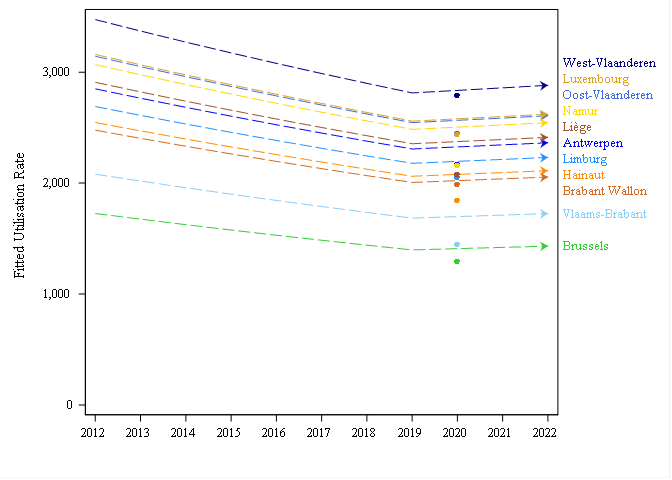
 Trends by region
 Trends break
 Dot Plot
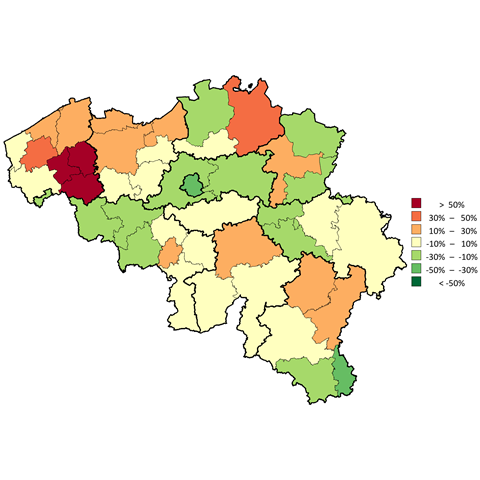
 Distribution map
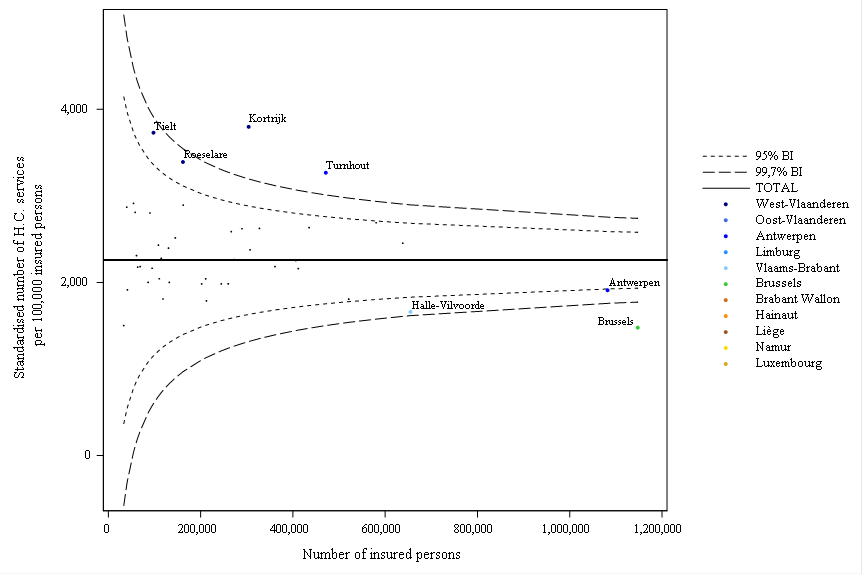
 Funnel plot
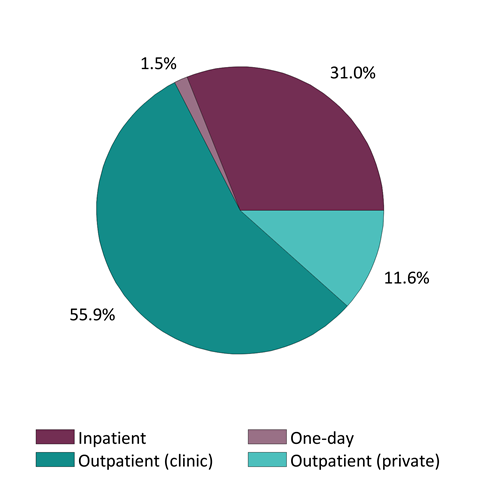
 Patient care settings
 Occurrences by Province
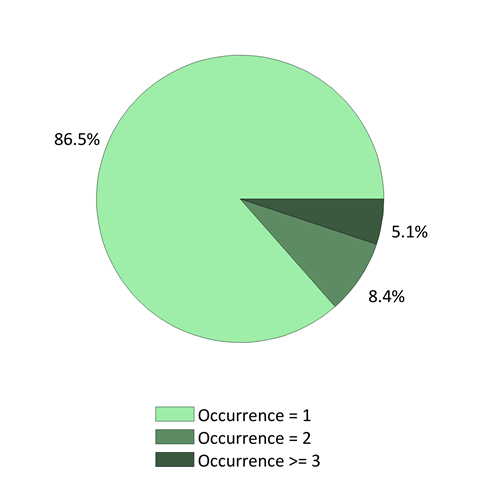
 National Occurrences
Download the methodology
Other official information and services: www.belgium.be 